¶ Introduction
Straight "out-of-the-box" Mira ABM will enable most analyses types on the basis of default (LINKS Analytics) assumptions, settings and models. You can follow the steps below to get set up and see quick results in the first few minutes of use.
¶ Logging-in first time
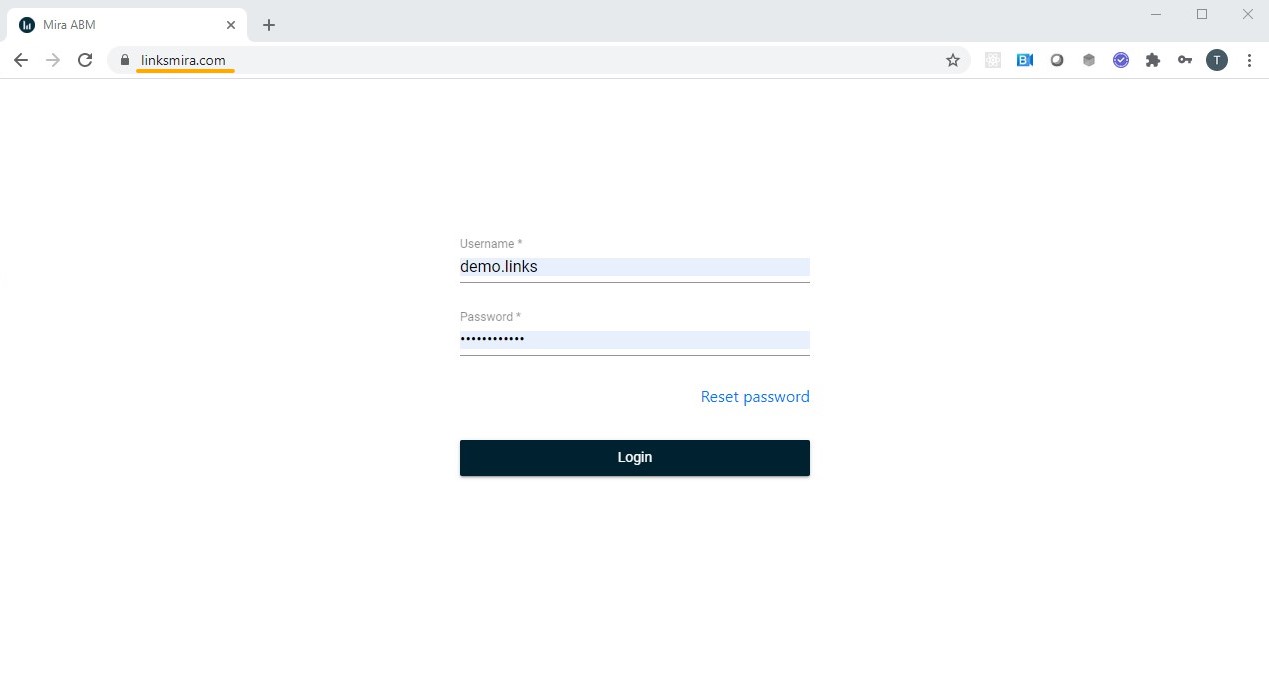
Mira ABM is accessible on www.linksmira.com with login and credentials that you received from LINKS Support. If you don't have those credentials, please reach out to your LINKS representative or email info@linksanalytics.com. In general, all browsers are supported, however, we recommend to use Chrome to be sure. If you experience difficulty logging in or in any other part of Mira functionality, please write us a note on support@linksanalytics.com.
¶ Dashboard and portfolio
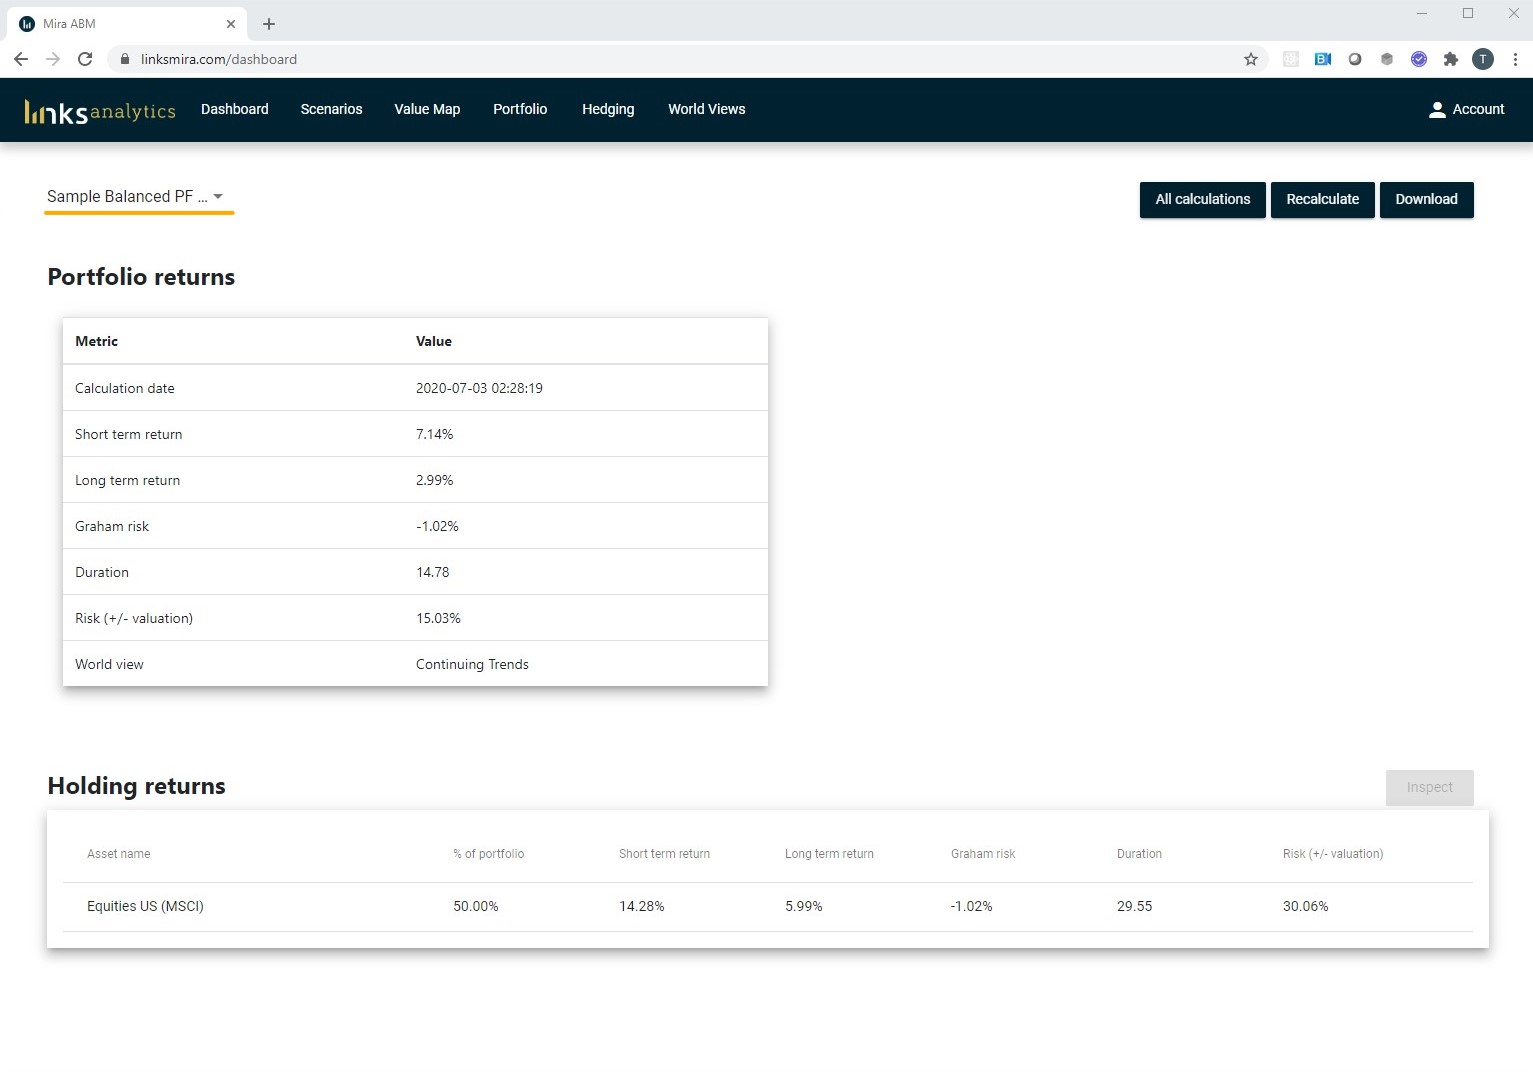
Right after logging in you will be taken to the Dashboard view. The Dashboard gives you a "helicopter view" of the expected returns of your portfolio or strategic asset mix. All analysis in Mira ABM is based on portfolios, i.e. you get summary results for a portfolio as well as portfolio constituents - asset classes/categories.
When you receive a "blank" Mira account, it is usually populated with one or more portfolios, with one or more assets classes each. It is good to keep in mind:
- Mira ABM accounts are corporate-specific, so all your analysis will be seen by all your colleagues. To enable a "private" analysis, you would need an additional set up.
- The number of assets and portfolios in the initial set up depends on your license and on-boarding agreements with LINKS. In a trial or basic set-up with no on-boarding, you will typically have one portfolio and one sample asset class in it. You can then add other asset classes (see the next section).
- Number of portfolios is limited in Mira ABM and is part of the licensing. If you would like to add a portfolio, please reach out to us.
The top left drop-down menu will enable you to select a portfolio to analyse. This will remain set throughout the session (across all analyses types) unless you change it again.
¶ Interpreting the results
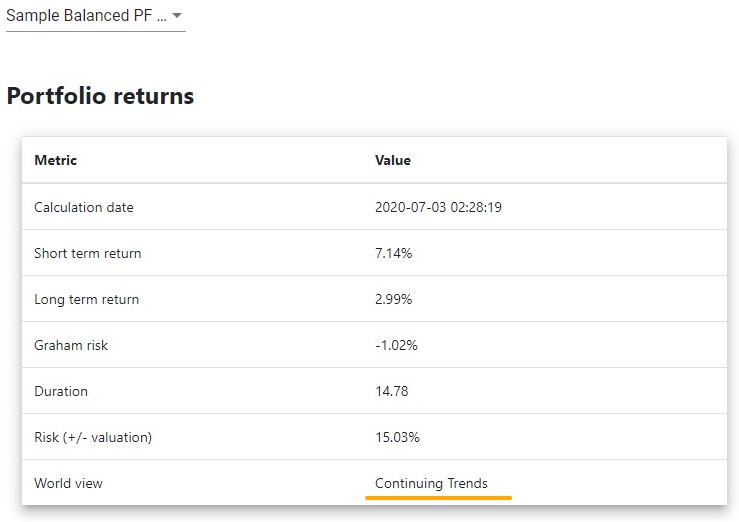
The first basic analysis that Mira ABM enables is the assessment of the current valuation of the portfolio and the returns you may expect going forward.
- Calculation date is the date returns were calculated. Asset prices, macro- and micro-economic numbers in Mira ABM are updated weekly, which means every Monday you will see a new date of calculation even if you don't recalculate the portfolio.
- Short-Term Returns are the expected returns of your portfolio in the first three years, as valuation of the price of the portfolio catches up with fair value. This is set at the first three years.
- Long-Term Returns are the steady-state return expectations after year three based on the World View set as default for your company. Please note, Personal Access Plan does not support setting customised World View.
- Graham Risk is the difference between the fair Internal Rate of Return (IRR) and the actual IRR implied by the current price of the underlying assets. For instance, if the Yield of the bond portfolio is 3% and the fair yield is 2.5%, then Graham Risk is 2.5% – 3% = -0.5%, which means the price of bonds is lower than the fair value, so the yield will have to increase by 0.5%. Similar calculation is carried out for equities (Equity Risk Premium), credits (spread) and all other asset classes.
- Duration is the modified duration for the bonds. Mira ABM also calculates duration for all other asset classes. It should be thought of as average cash flow pay back period. For more on methodology, please check the methodology section.
- Risk (+/- valuation) is the over-/under-pricing of the portfolio assuming the valuation corrects instantly.
- World view is the set of long-term assumptions with regards to macro-economic variables that are used to run the calculation.
When you first run your analysis, your account will reflect default assumptions of LINKS Analytics. Based on those, just like that you already have your 1-15 year asset return estimations.
Below the portfolio-level summary you can find the attribution of results by portfolio holding. Interpretation of the columns is the same as for the portfolio level.
Mira ABM aims at bringing as much transparency in calculations as possible. Each holding line calculation can be inspected, including the underlying models and data inputs by clicking on the line and clicking on Inspect.
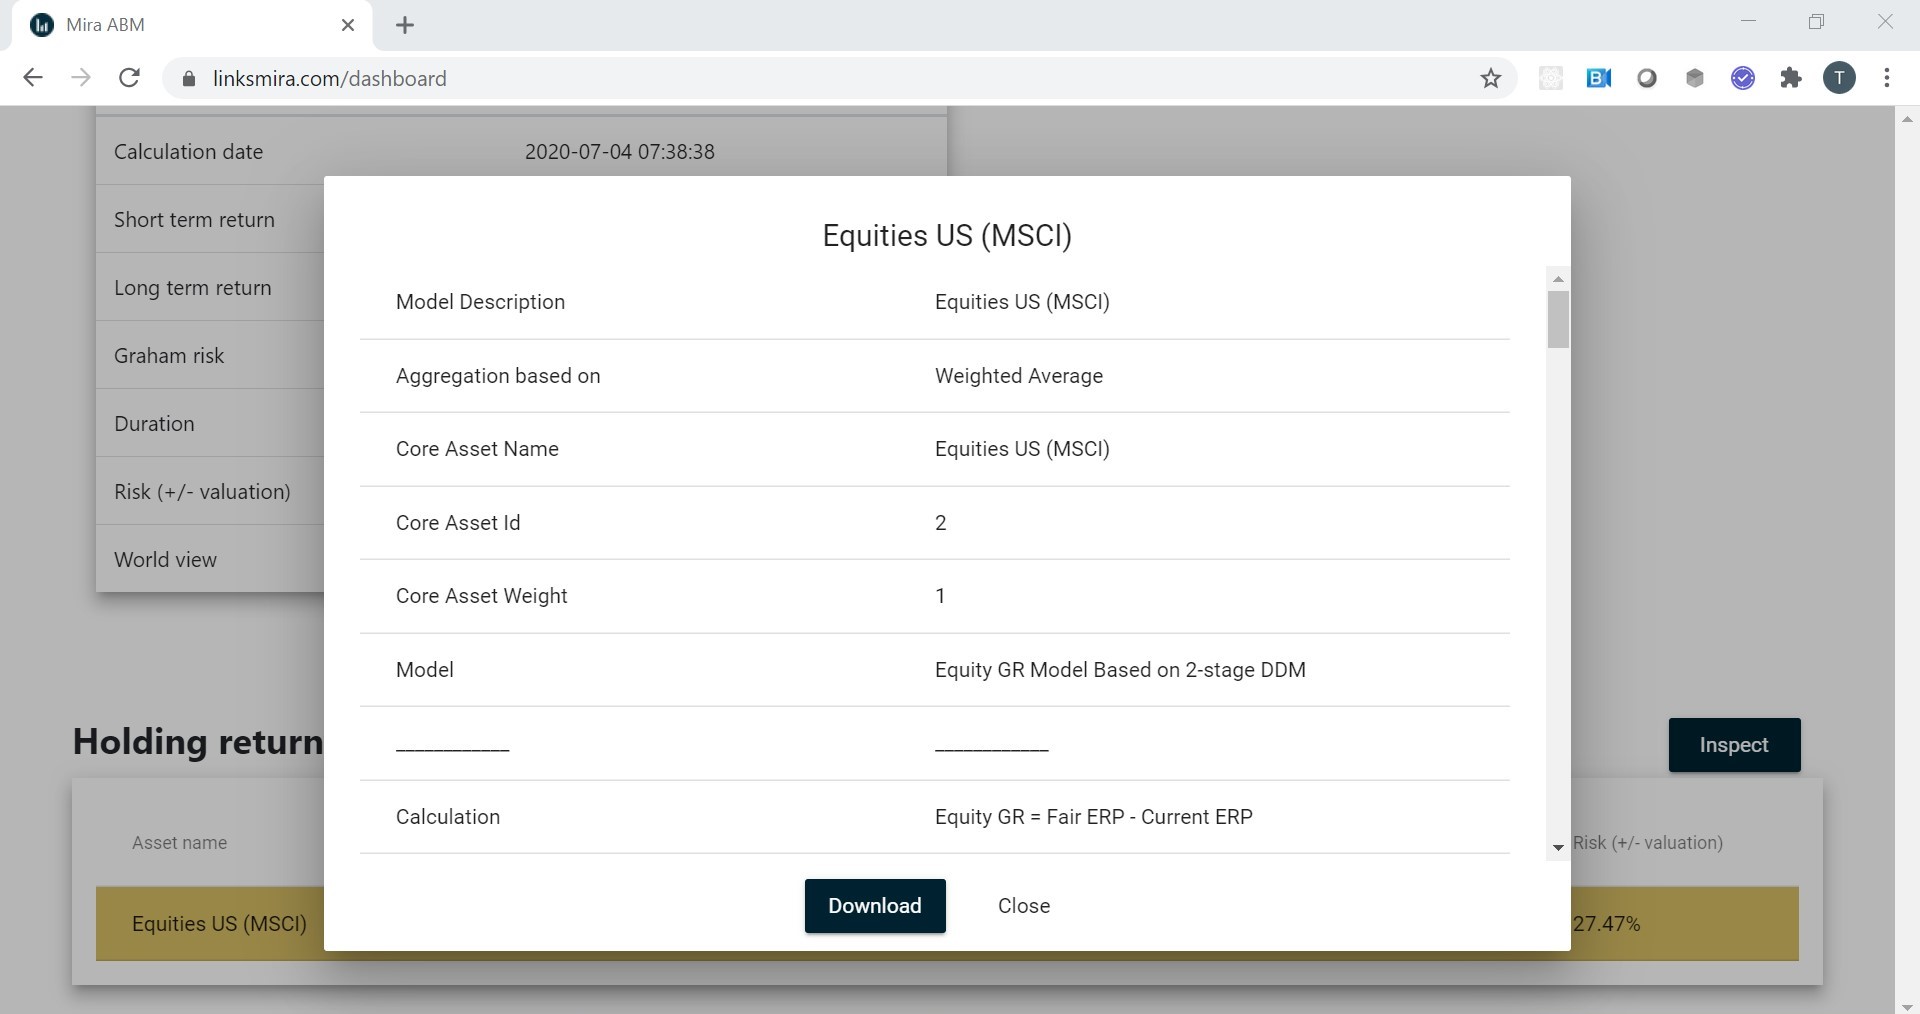
You can download the inspection data into CSV format for further analysis.
¶ Editing your portfolio
Of course, you need to adjust the portfolio to reflect your strategic asset mix. Mira ABM does not work with actual investment instruments, but rather with Asset Classes or categories. US Equities, for instance, are one asset category. While you cannot directly invest in asset category, most of these categories are based on an index and have several ETFs tracking them.
- The list of available asset classes in Mira ABM is specific to the user (company).
- During the on-boarding process, depending on the license, LINKS will construct the list of available asset classes to match your needs, including specifically benchmarks used by your institution.
- Each asset class (holding) is based on a specific forecasting model. In most cases, this is the default LINKS model. However, once again, during the on-boarding LINKS may replace default models with the approach to calculation that is specific to your institution.
In order to adjust the portfolio, go to the Portfolio tab in the top menu:
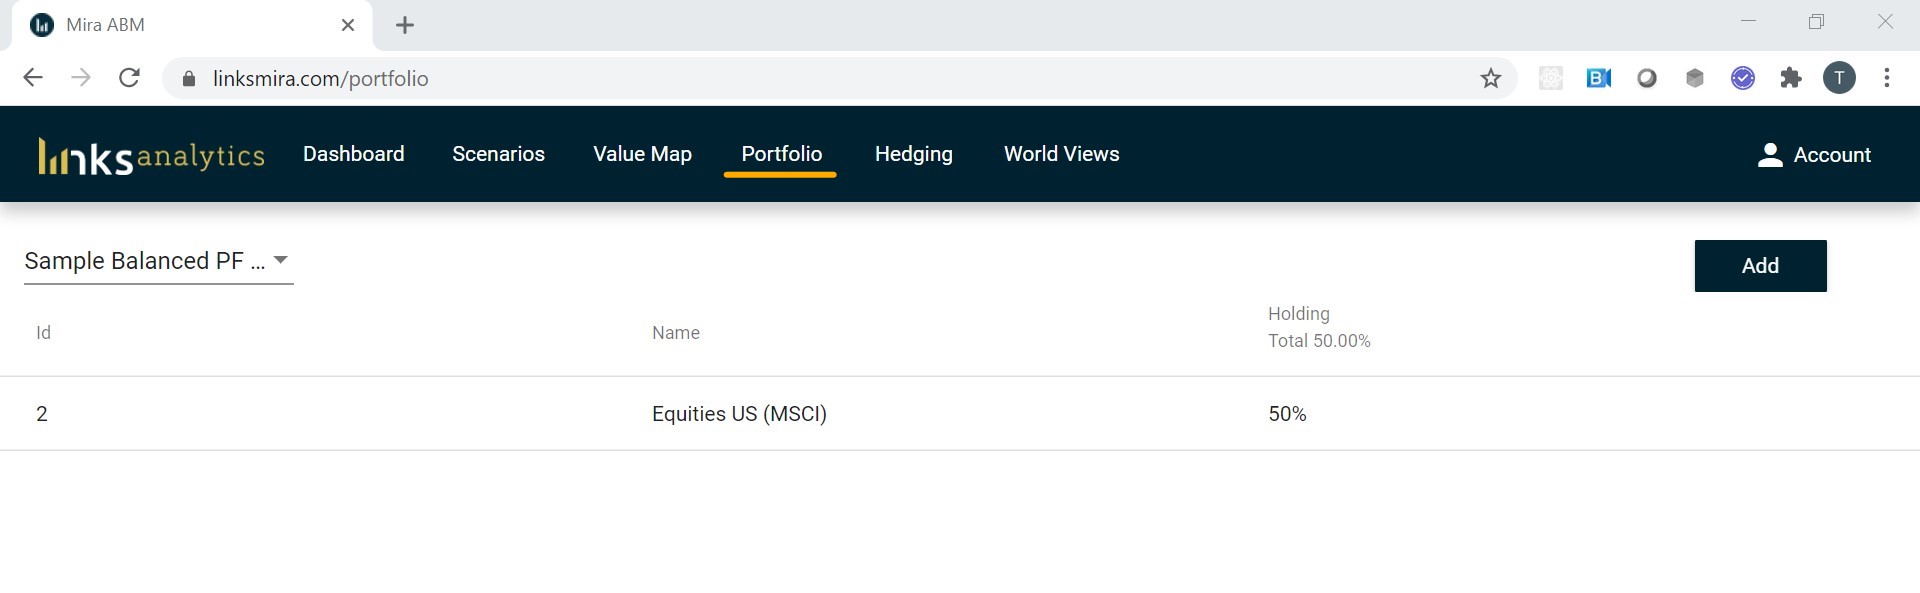
In order to add a new asset class, simply click on the add button, select an asset class from a drop-down menu (or type the first letter to filter the list) and add the weight you need: entering 10 in the field would mean 10% weight in the portfolio.
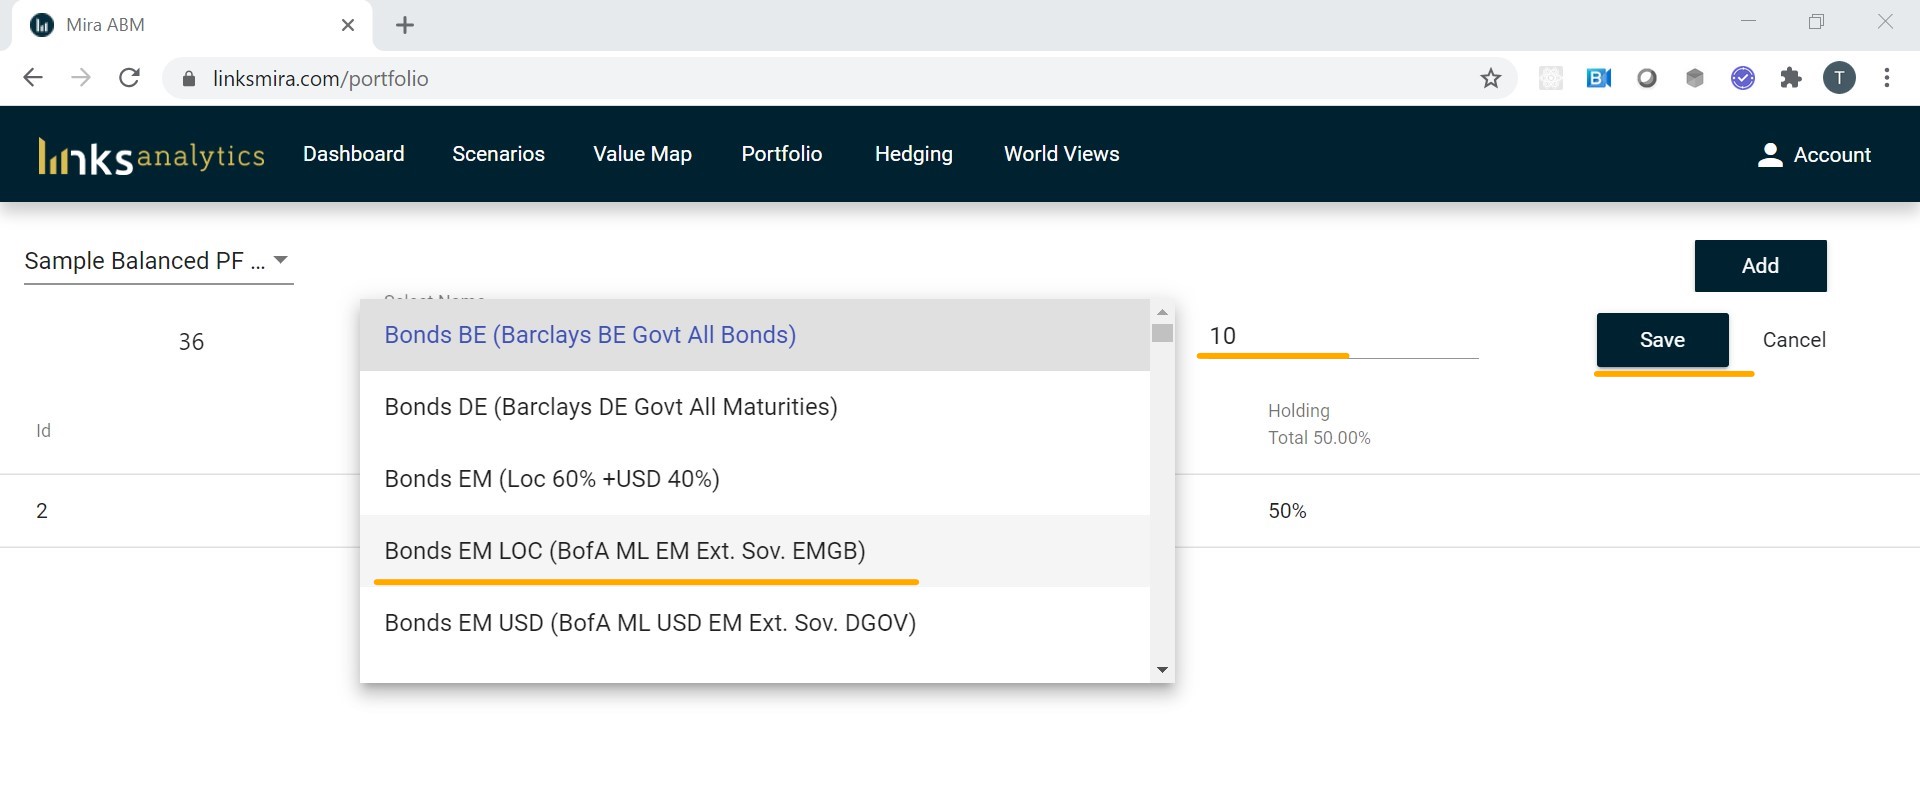
Finally click on Save and your asset class will appear in your preliminary list.
- IMPORTANT: simply saving the asset class does not yet adjust the portfolio. In order to finalize your portfolio, you need to click Upload and select the available options. If you simply leave the Portfolio tab without clicking Upload, the changes will be lost.
- The weights of asset classes do not need to add to 100%. Total weight of less than 100% means holdings in cash. Total weight of more than 100% means application of leverage.
You can adjust an existing asset class by clicking on it:
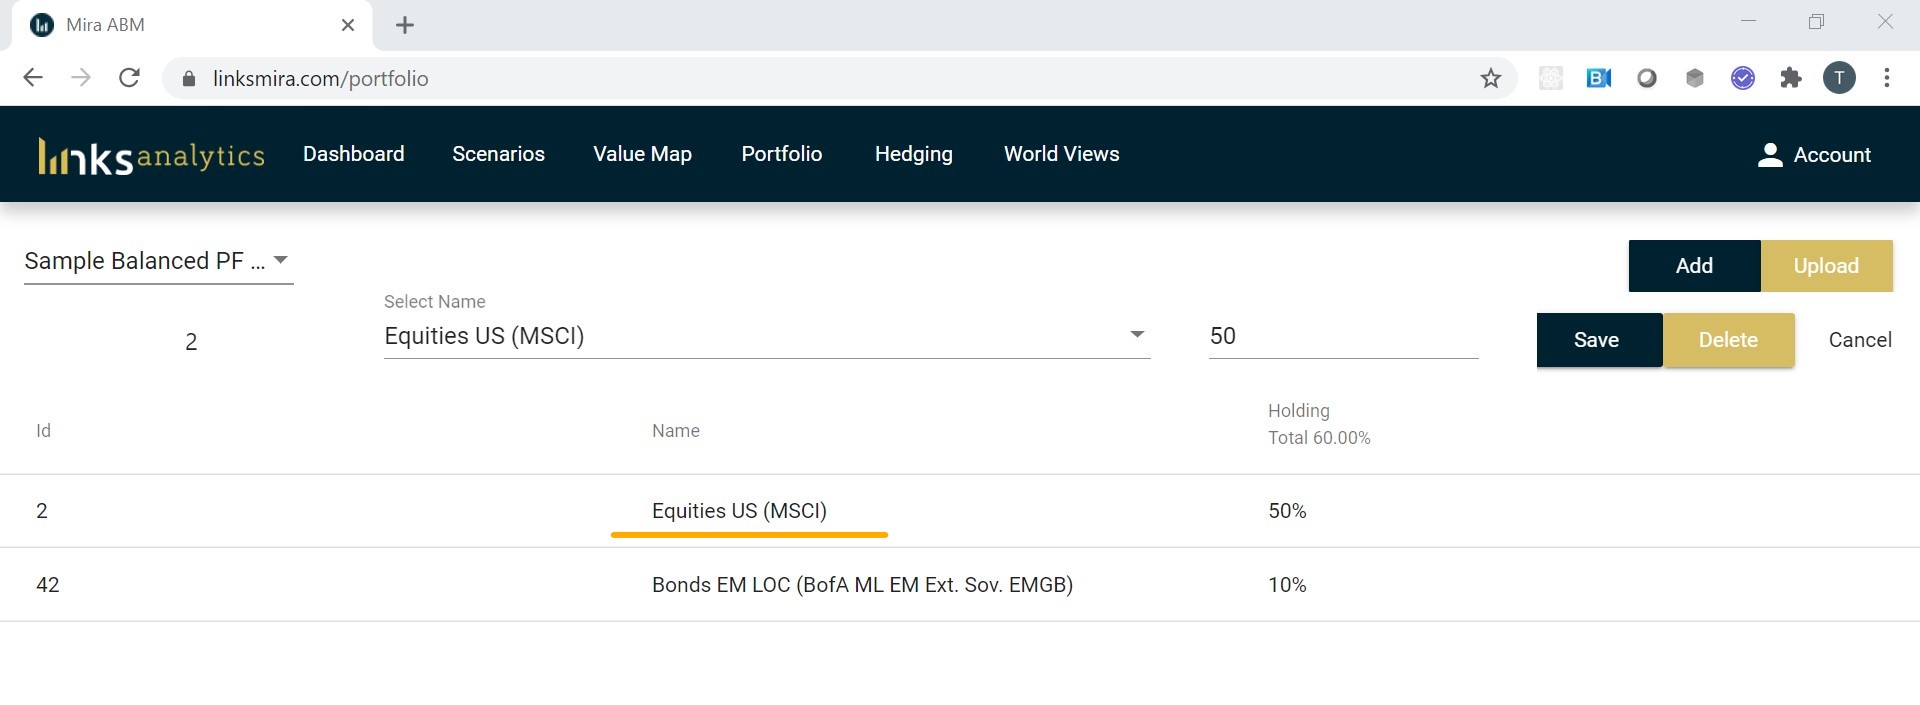
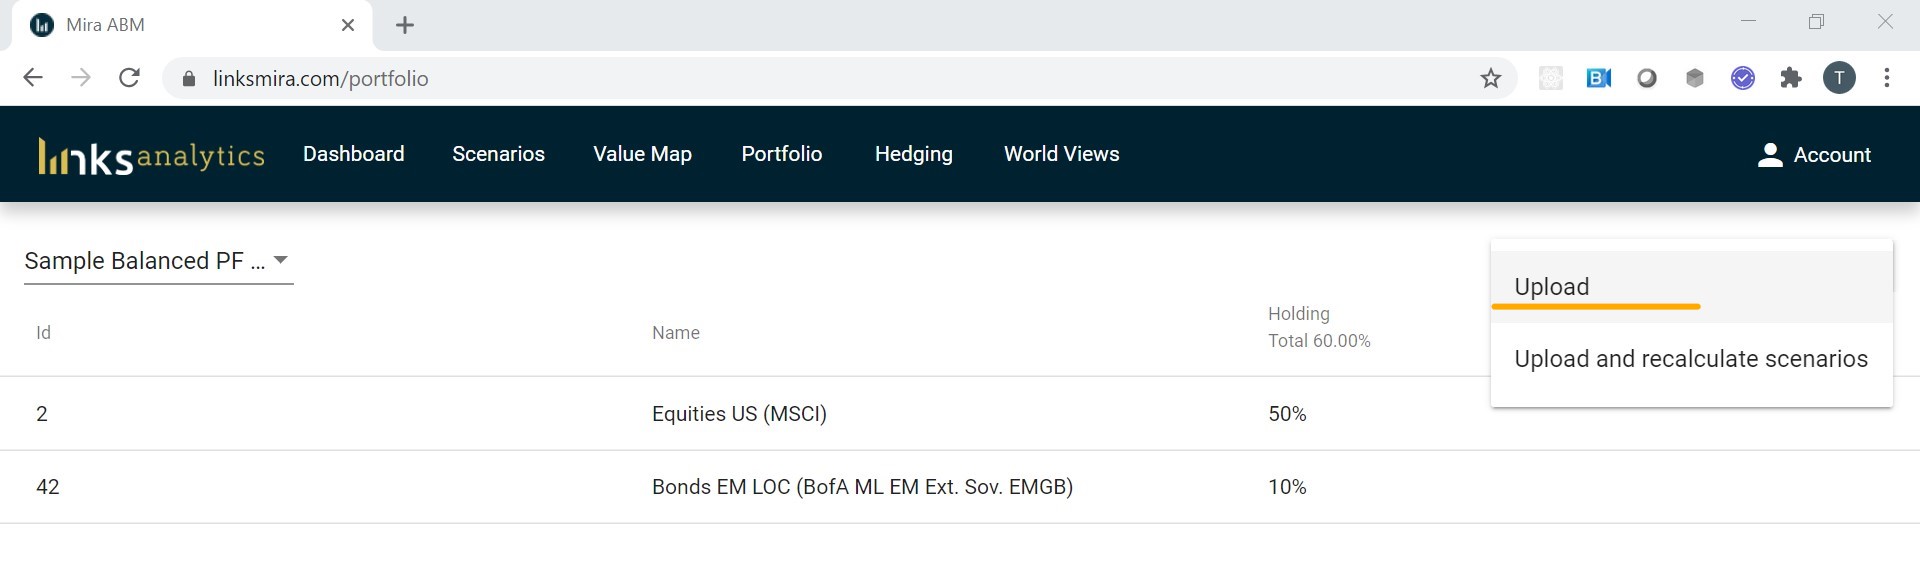
Finally, once you are satisfied that the portfolio correctly reflects your asset allocation, you can click on Upload. You will be presented a choice:
- Upload: update the portfolio and recalculate the expected returns under no-stress assumptions
- Upload and recalculate scenarios: update the portfolio, recalculate the expected returns under no-stress assumptions as well as most recent major LINKS stress scenarios (this latter option may take several minutes to complete).
IMPORTANT: recalculating portfolios takes time (usually about a minute, but may be longer depending on the number of stress scenarios). It is a good practice to fully edit the portfolio into its final state and click on Upload once, rather than make incremental changes.
After uploading the portfolio, you can go back to the Dashboard tab. The results of the edited portfolio will be available in a few minutes. In this period you may see unusual or missing values in the Dashboard. Once the calculation is complete, it will show up in the All calculations list with the current date/time. In order to access earlier calculations, you can select them and click on Run.
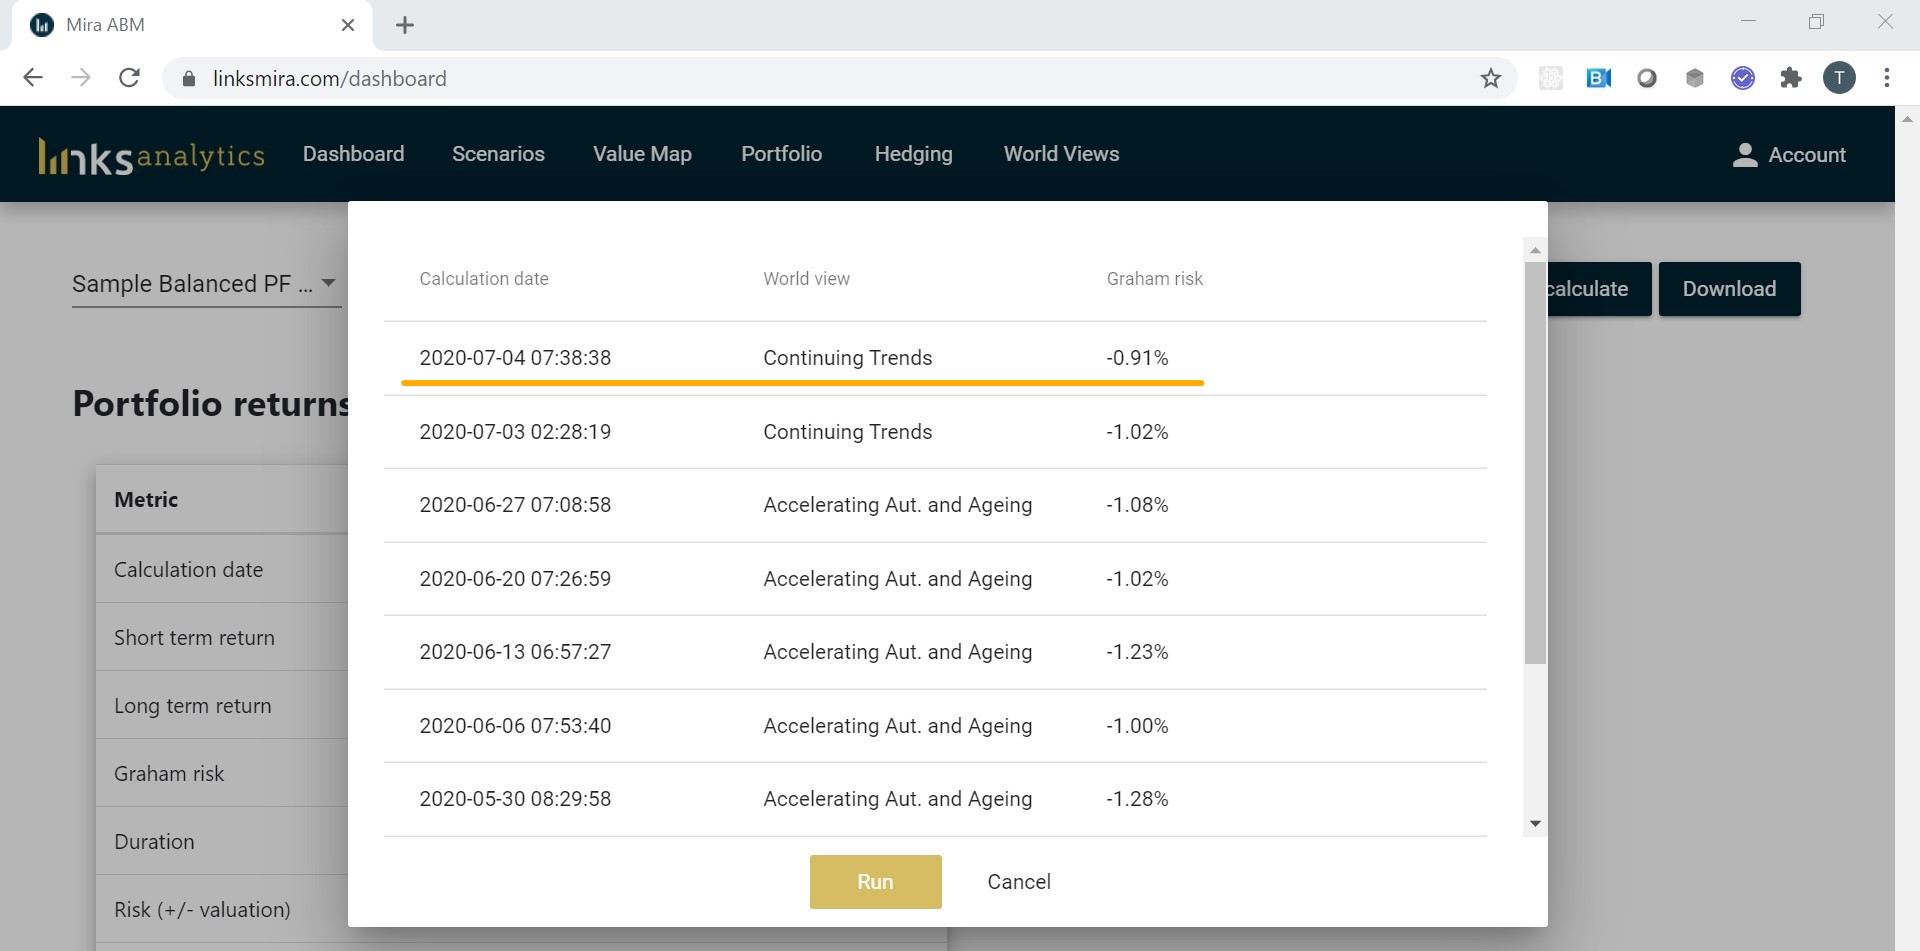
IMPORTANT: all historical calculations are based on the portfolio structures at the time. If the structure of your portfolio has changed, it is not possible to get a historical calculation. Mira ABM is primarily a forward looking strategic investment toolkit and does not focus on back-testing and signal generation.
¶ Short-term stress tests
Stress tests or stress scenarios in Mira ABM are carried out on using Agent-Based Modelling (ABM). In an ABM, an initial stress involving price and/or volume changes in production in one or more countries and industries is used to assess the impact on all the supply chains. The change in profits across 70 industries in 40 countries is then calculated and aggregated to arrive at the new levels of Returns on Capital and level of prices. The new pricing and ROC are then translated into asset class pricing.
LINKS periodically applies stress tests to all client portfolios. However, if you have changed the structure of the portfolio in the previous step, you would need to recalculate the scenarios. This is done either in the Dashboard by selecting Recalculate -> Recalculate scenarios or in the Portfolio tab selecting Upload and recalculate scenarios during the portfolio construction stage.
After updating the scenarios, which may take several minutes, you can select the Scenarios tab:
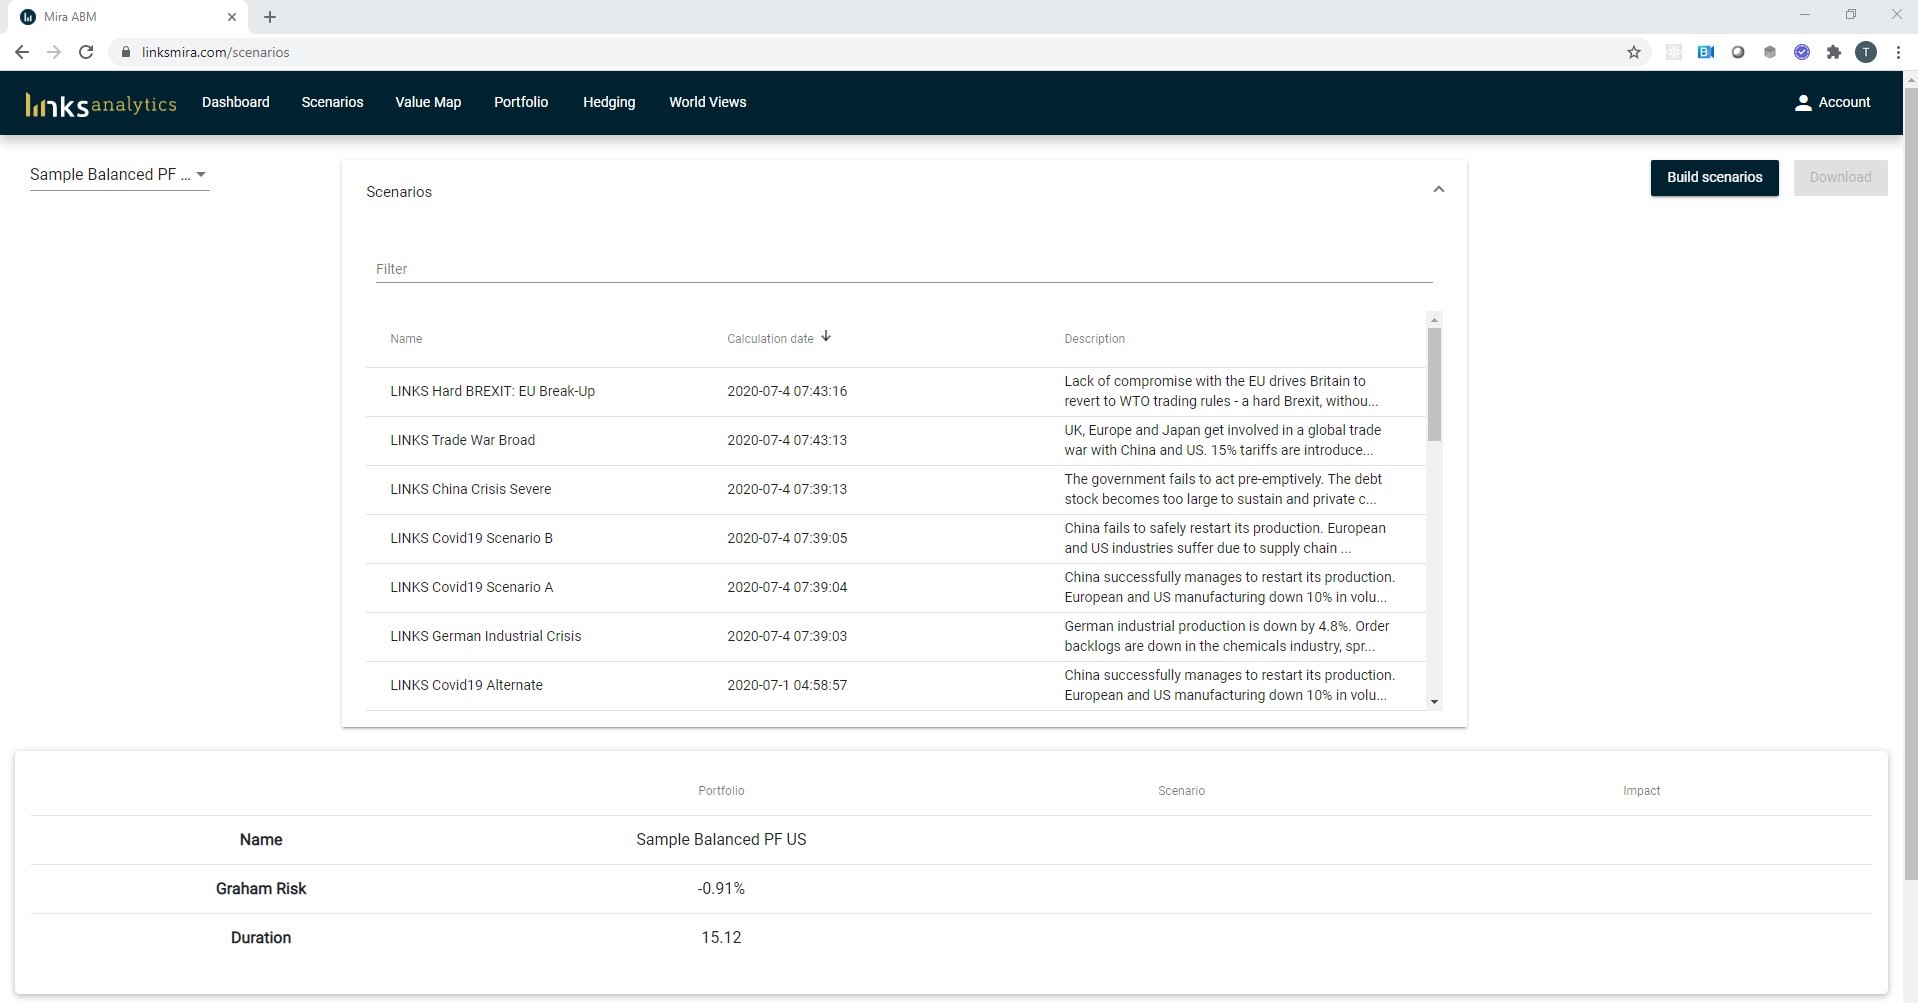
Selecting a scenario gives you the instant impact on the portfolio as well as holding level impacts:
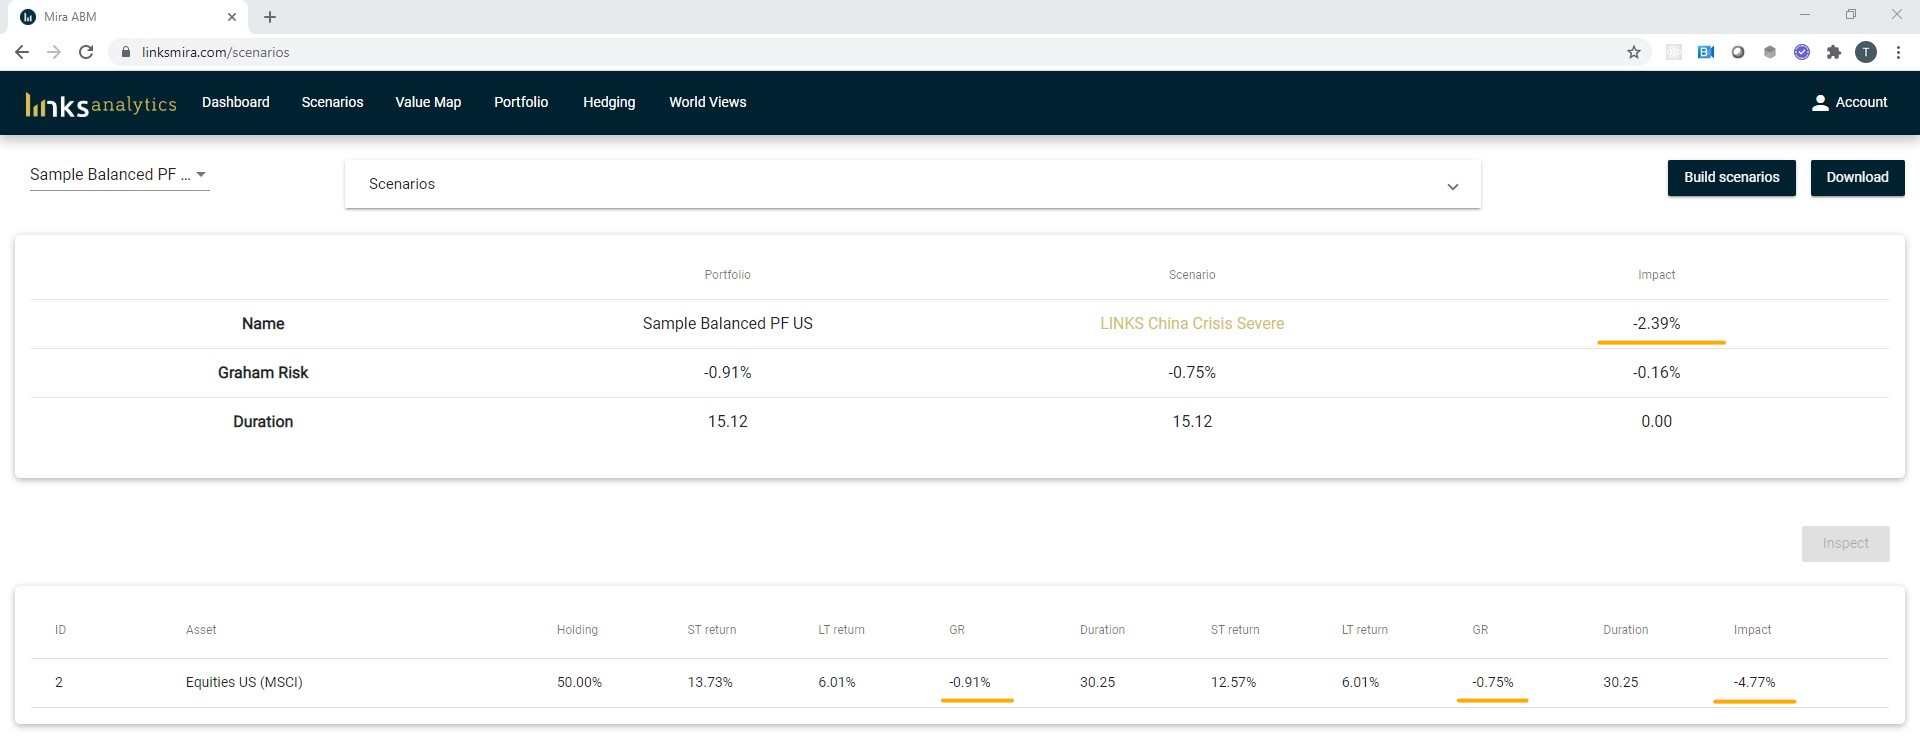
Impact on the portfolio level in the example above is -2.39%, which is due to holding 50% of the portfolio in US Equities that are estimated to fall by 4.77% (since there is no other asset class, the system assumes a 50% cash holding). At the holding level there are two sets of columns, each with ST return, LT return, GR and Duration. The first set is for the calculation of returns in a non-stress event. These are the same numbers as in the Dashboard. The second set is the calculation of the returns in a stress case.
The Impact of the stress test is calculated relative to the no-stress case. If an asset class was underpriced to begin with, a negative impact would decrease the underpricing and the impact is that relative decrease. In the example above, for instance, US Equities were "cheap" to begin with (as evidenced by the first Graham Risk (GR) -0.91%, which means its Equity Risk Premium is 0.91% above the fair level). However, the stress scenario brings this GR up to -0.75%, or a difference of 0.16%. A change of IRR of 0.16% for an investment with duration of 30.25 would result in a total impact of -0.16 * 30 = -4.8%, i.e. the impact number you see on the left.
IMPORTANT: The scenario list is a continuous list sorted on date. A scenario cannot be edited or deleted, however, you can build a new scenario by copying from an existing scenario.
Building scenarios and interpreting the inputs is covered in our Comprehensive Guide.